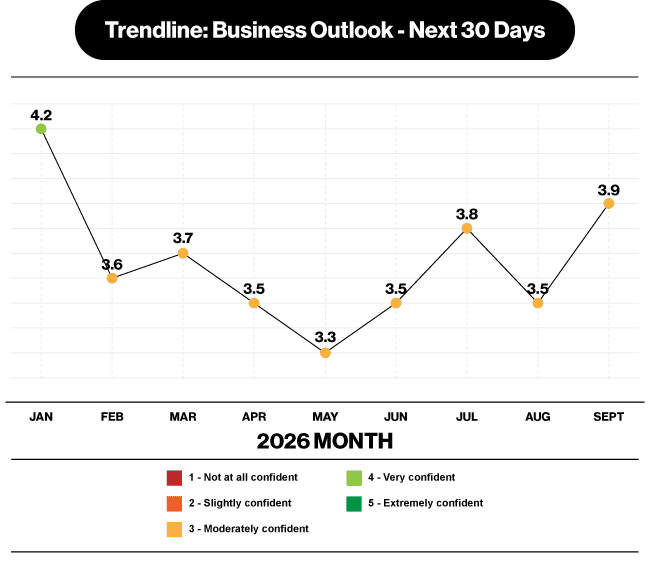
To better understand how confident beauty professionals and beauty schools feel about their businesses, the Professional Beauty Association (PBA), in partnership with PBA Business Member Pivot Point International, created the Pro Beauty Pulse.
This monthly index tracks industry sentiment across W-2 beauty professionals, independent professionals, salon owners, and beauty school leaders. We also include data from The KIM Report, providing real-world salon performance results to complement sentiment insights.
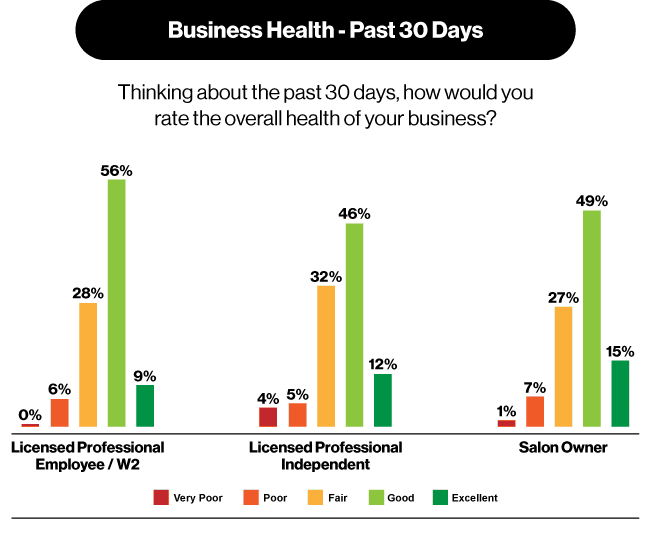
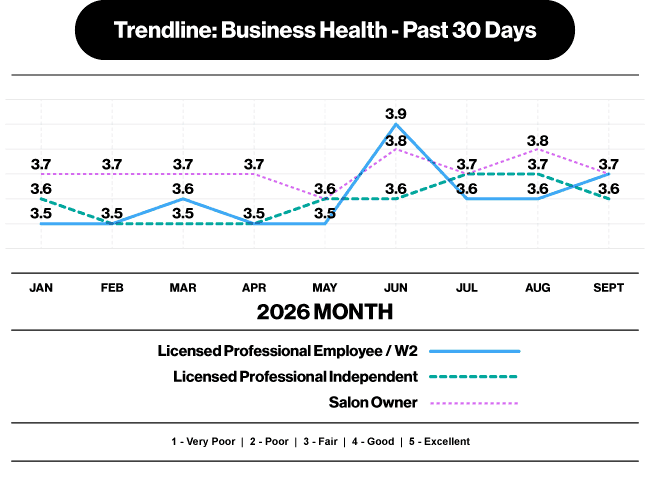
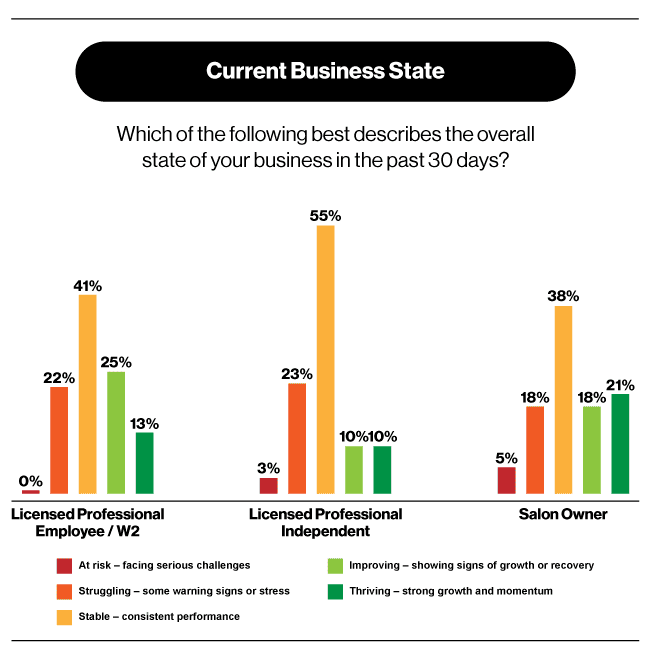
PERCEPTION VS. REALITY
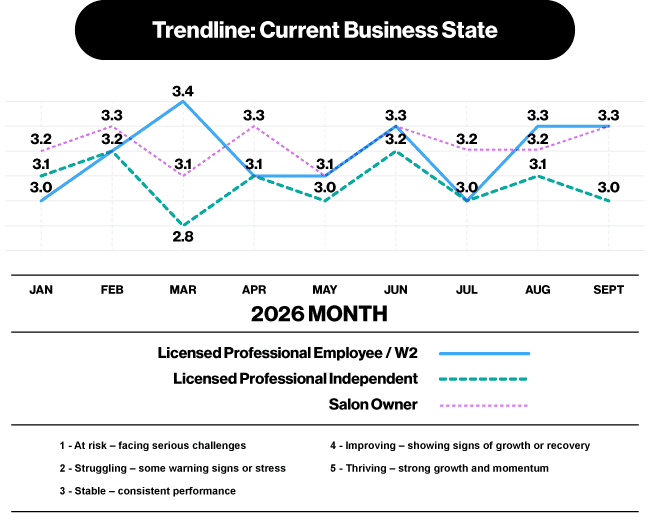
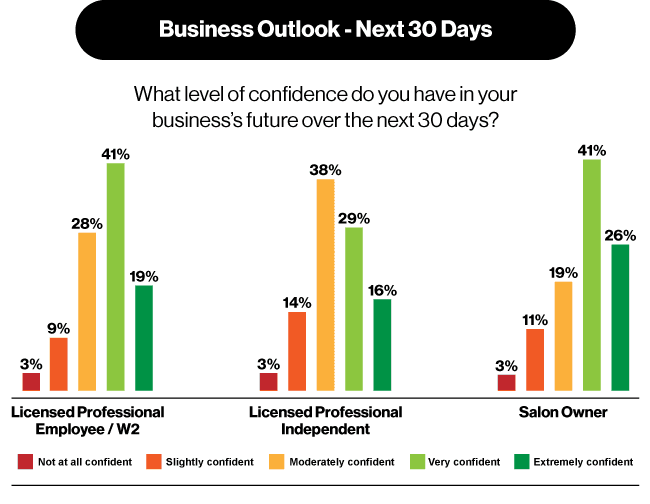
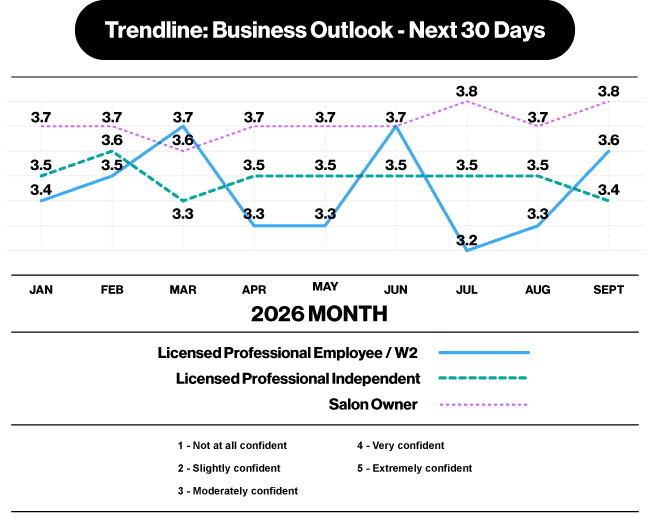
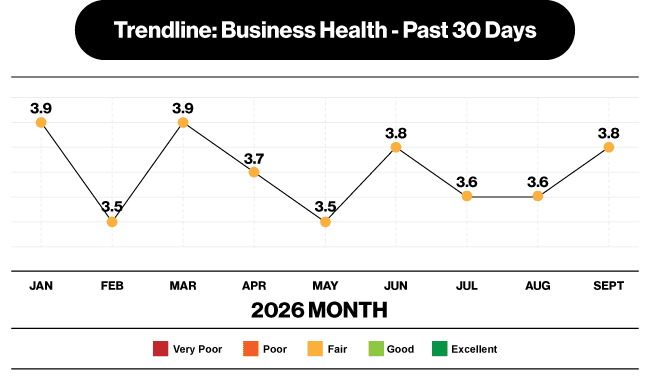
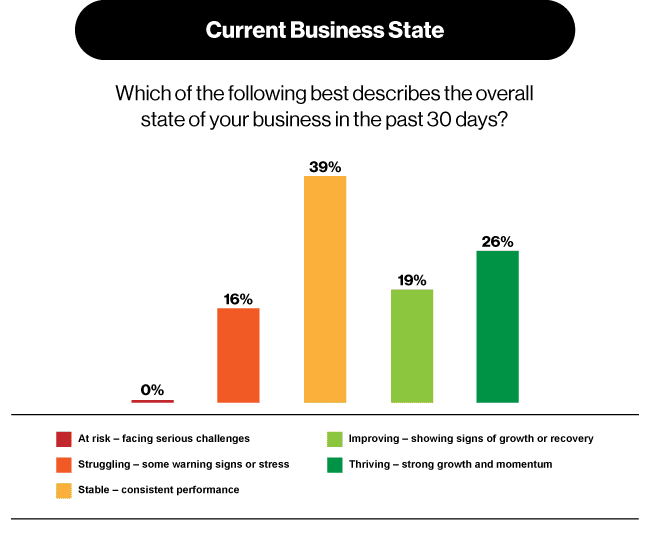
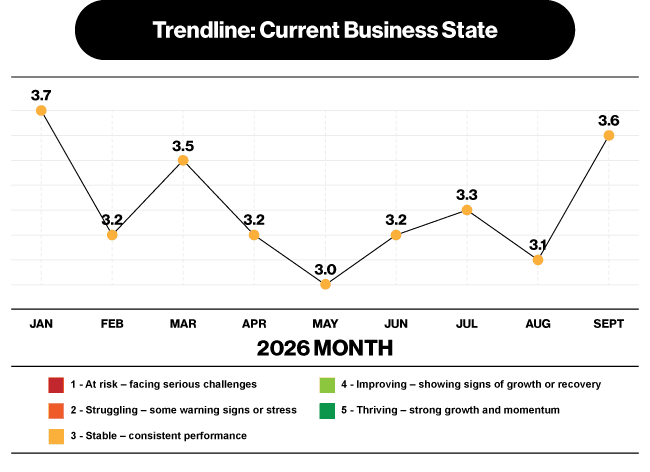
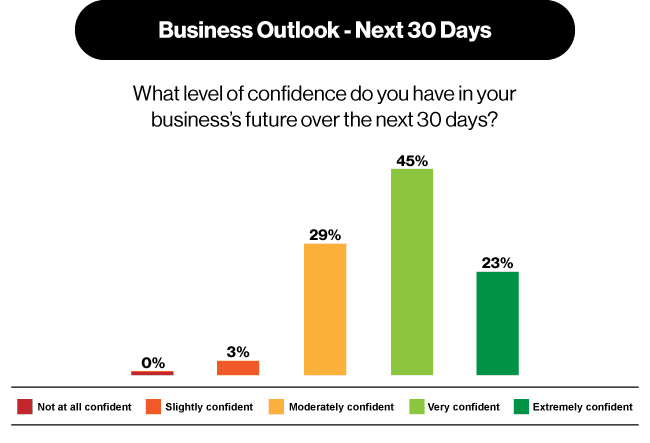
The charts above reflect sentiment collected in September when industry professionals were asked to assess their business conditions for August.
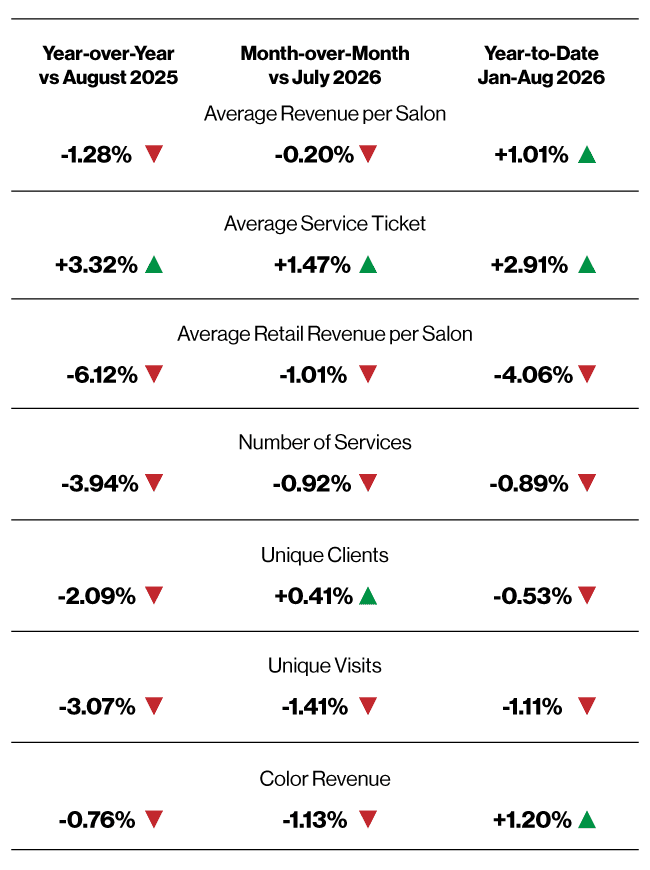
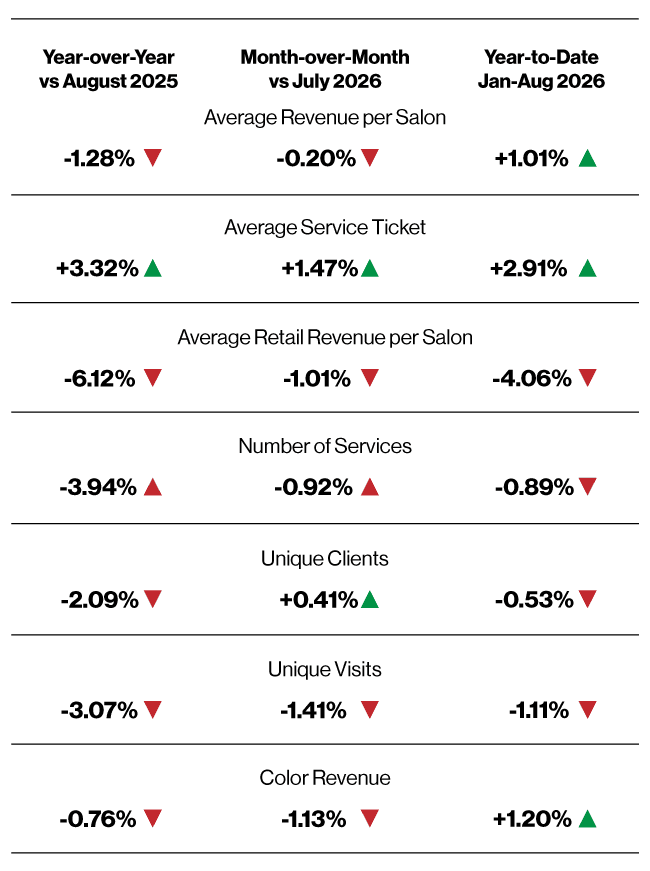
The data below, sourced from The KIM Report, shows actual industry performance for August.
Viewed together, these offer a comparison of how salon industry perceptions compare to salon industry results.
KEY TAKEAWAYS:
August was the first month since May to finish below the prior year, with revenue down 1.28% from August 2025. However, the decline was largely due to the calendar: August 2026 had five Mondays and four Fridays, compared with four Mondays and five Fridays in 2025. Monday is the weakest day of the week, while Friday is among the strongest. On a matched-weekday basis, revenue per salon increased on five of seven days. The headline is negative, but the underlying performance is not.
Pricing continues to drive revenue, with the average service ticket up 3.32% year over year.
Retail remains a volume problem. Units sold fell 12.22%—the steepest decline of the year—while retail revenue declined by only 6.12%, cushioned by a 6.95% increase in the average product price.
Performance also varied by salon size: smaller salons had a more difficult month, while larger salons generally performed better. This K-shaped pattern in salon growth is becoming increasingly noticeable.
KEY TAKEWAYS:
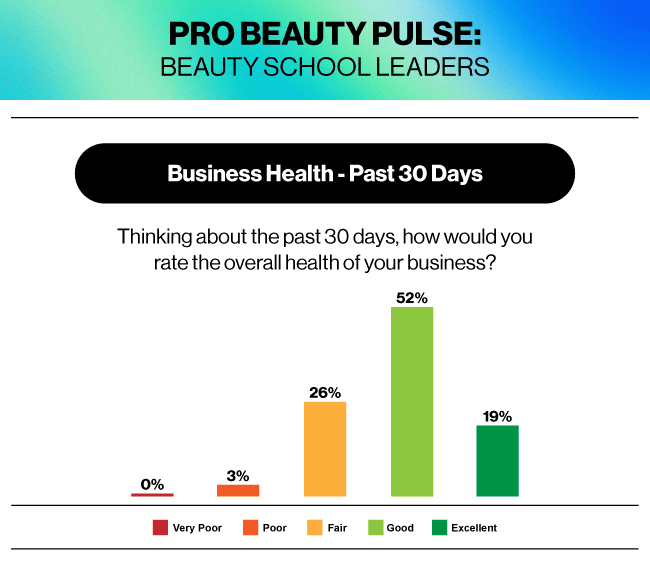
School confidence improved across all three measures, possibly reflecting stronger enrollment, lead flow or student starts, as well as reduced anxiety following the federal reprieve. However, schools may be responding primarily to immediate
conditions and may not yet have fully incorporated longer-term government and regulatory risks into their outlook.
The KIM Report aggregates data from more than 10,000 salons and solopreneurs, each with 24 consecutive months on the same software platform to ensure data consistency and reliability.

August was the first month since May to finish below the prior year, with revenue down 1.28% from August 2025. However, the decline was largely due to the calendar: August 2026 had five Mondays and four Fridays, compared with four
Mondays and five Fridays in 2025. Monday is the weakest day of the week, while Friday is among the strongest. On a matched-weekday basis, revenue per salon increased on five of seven days. The headline is negative, but the underlying
performance is not.
Pricing continues to drive revenue, with the average service ticket up 3.32% year over year.
Retail remains a volume problem. Units sold fell 12.22%—the steepest decline of the year—while retail revenue declined by only 6.12%, cushioned by a 6.95% increase in the average product price.
Performance also varied by salon size: smaller salons had a more difficult month, while larger salons generally performed better. This K-shaped pattern in salon growth is becoming increasingly noticeable.
STAY INFORMED
Explore more insights in The KIM Report, your source for real-world data and monthly performance trends shaping the professional beauty market.